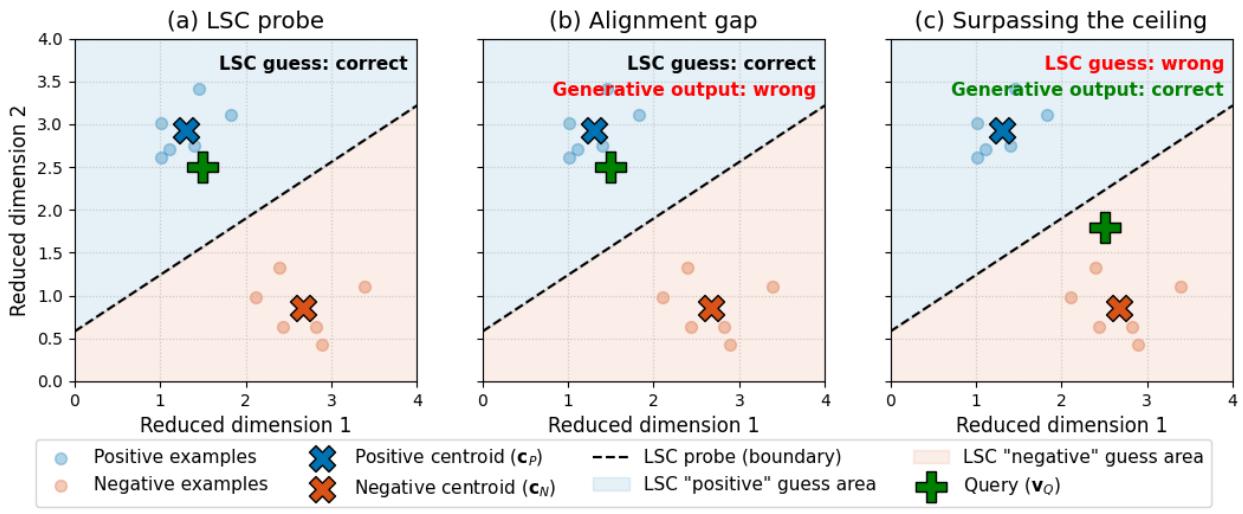
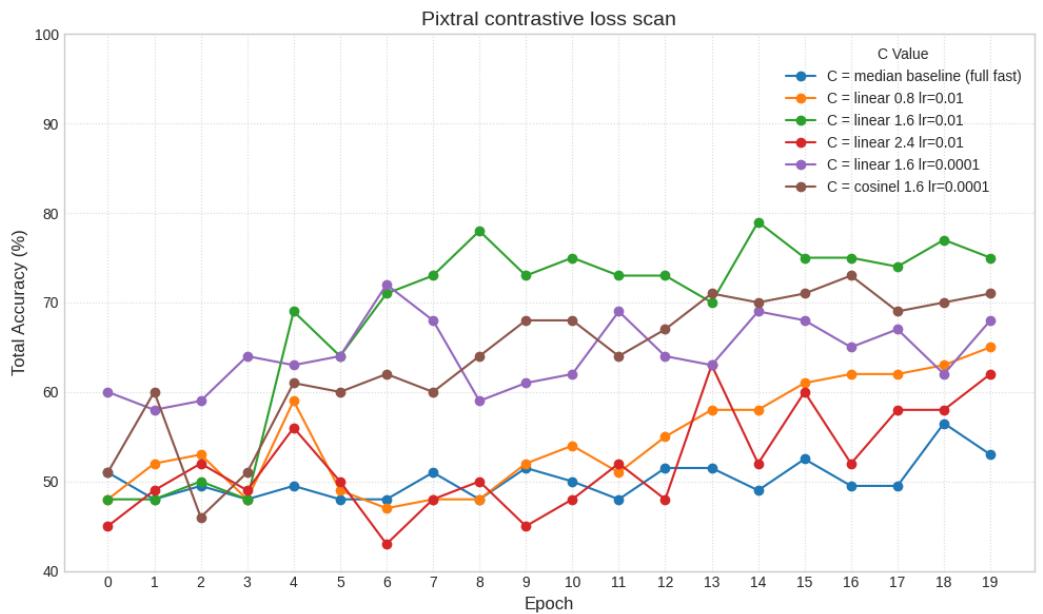
Figureure 2 · : Illustration of the framework and its classifications, explaining PCFigure 2: Illustration of the framework and its classifications, explaining PCA scenarios observed empirically. The LSC probe (dashed line) is the linear boundary between positive (cP ) and negative $\left( c _ { N } \right)$ centroids. (a) LSC probe: the query $( v _ { Q } )$ is correctly classified by the linear probe. (b) Alignment gap: classified when generative accuracy is on average not statistically superior to the LSC $\left( p \ge 0 . 0 5 \right)$ . The LSC probe succeeds, but the generative model fails. A non-linear model is expected to outperform its linear probe; failure to do so suggests a misalignment. (c) Surpassing the ceiling: classified when generative accuracy is on average statistically superior to the LSC $\left( p < 0 . 0 5 \right)$ . The LSC probe fails, but the generative model succeeds.这张图概括 Beyond the Linear Separability Ceiling 的整体方法流程。阅读时先看模块之间传递的训练信号,再看作者如何把目标拆成可优化的子问题。Figure A.3: Illustration of contrastive loss hyperparameter scan results for PixtralFigure A.3: Illustration of contrastive loss hyperparameter scan results for Pixtral. Plot displays model accuracy after every epoch (0-indexed) for selected hyperparameters.这张图/表用于判断 Beyond the Linear Separability Ceiling 的实验收益来自哪里。重点看替换、消融或跨模型设置下趋势是否一致,而不是只看单个最高分。