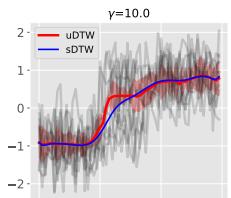
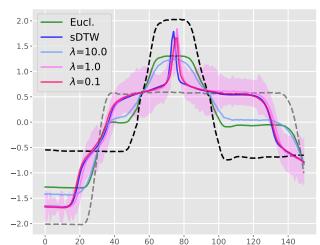
0 0 20 40 60 (b) Synthetic Control Fig0 0 20 40 60 (b) Synthetic Control Fig. 6. Comparison of barycenters computed with sDTW and uDTW on CBF and Synthetic Control. Uncertainty for uDTW is shown in red. Even with high γ (e.g., γ = 10.0), uDTW produces reasonable barycenters; higher γ smooths the barycenter but increases uncertainty.这张图/表用于判断 Uncertainty-DTW for Visual Tokens 的实验收益来自哪里。重点看替换、消融或跨模型设置下趋势是否一致,而不是只看单个最高分。(b) λ (where β = 10) Fig(b) λ (where β = 10) Fig. 5. Interpolation between two time series (grey and black dashed) on the Gun Point dataset. The barycenter is obtained by minimizing an uncertaintyaware uDTW objective, where β penalizes high matching uncertainty and λ regularizes it toward unit variance. Compared to Euclidean (green) and sDTW (blue) barycenters, uDTW produces distinct interpolations by adaptively weighting alignments according to uncertainty.这张图来自论文 PDF 的结构化抽取。当前用于辅助理解 Uncertainty-DTW for Visual Tokens 的方法或实验,请结合正文精读段落一起看。