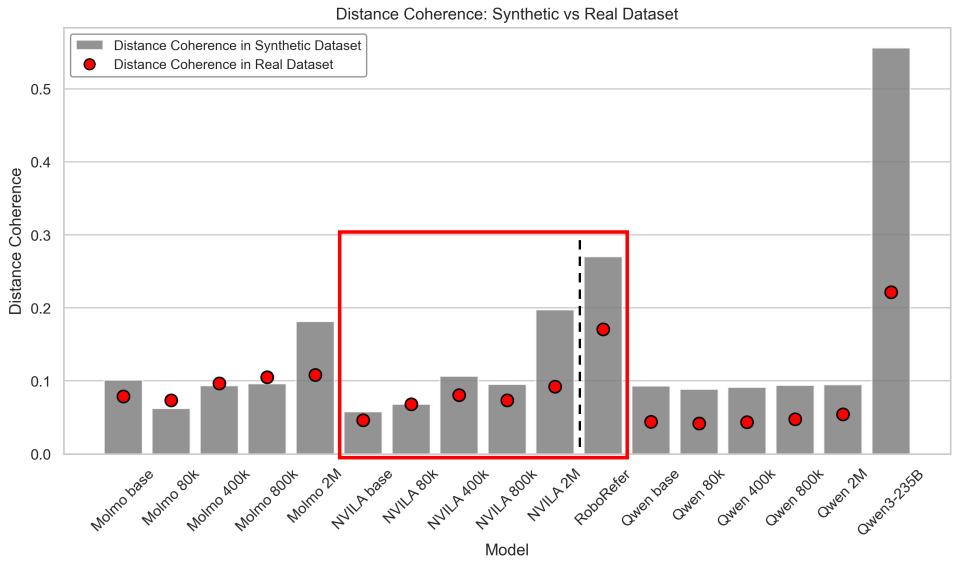
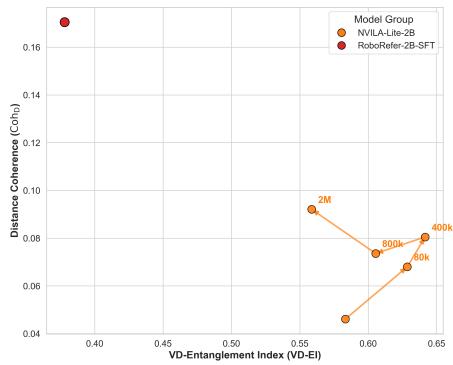
Figureure 10 · : Distance Coherence measured on synthetic (SpatialTunnel) vsFig. 10: Distance Coherence measured on synthetic (SpatialTunnel) vs. real (EmbSpatial-Bench) datasets. Gray bars denote CohD computed on SpatialTunnel; red dots denote CohD on EmbSpatial-Bench. Although the absolute magnitudes differ across domains, the relative ordering within each model family is largely preserved. The red box highlights the NVILA family, where the ranking is identical across both datasets.这张图来自论文 PDF 的结构化抽取。当前用于辅助理解 Why Far Looks Up 的方法或实验,请结合正文精读段落一起看。(b) Distance Coherence vs(b) Distance Coherence vs. VD-EI Fig. 6: Internal probing analysis of spatial representations. (a) Positive correlation between behavioral accuracy on counter examples and internal distance coherence (CohD). (b) Comparing distance coherence (CohD) against geometric entanglement (VD-EI) within the NVILA family; RoboRefer occupies a unique region of high coherence and low entanglement. Unlabeled points denote base models, and numeric labels (e.g., 80k) indicate data-mix fine-tuned variants.这张图/表用于判断 Why Far Looks Up 的实验收益来自哪里。重点看替换、消融或跨模型设置下趋势是否一致,而不是只看单个最高分。