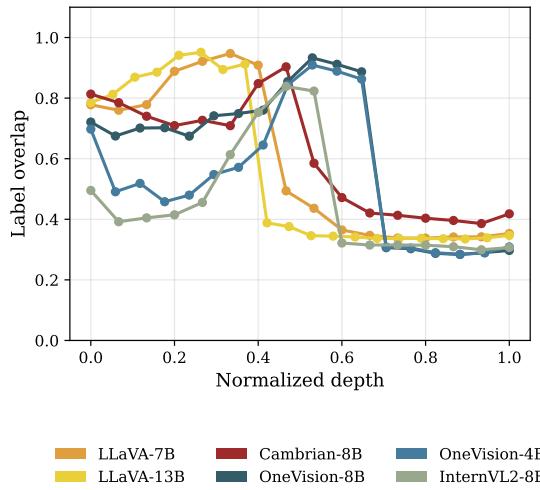
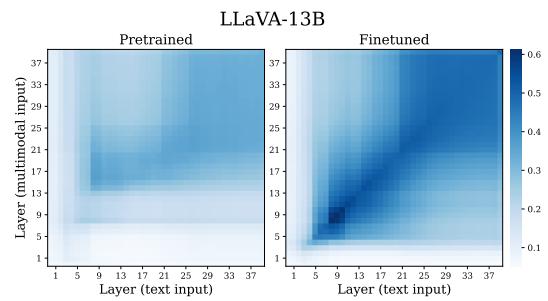
Figureure 14 · : Average Label Overlap across models depthFigure 14: Average Label Overlap across models depth. We compare the nearest-neighbor structure of each layer’s last-token representation with the correct class labels in 10-option image-classification prompts. Each curve is one model, averaged over mini-ImageNet, Food101, SUN397, Caltech101, DTD, Flowers102, and Places365. The shared drop after the intermediate layers indicates that class-level semantic geometry is strongest before final answer-token formation.这张图来自论文 PDF 的结构化抽取。当前用于辅助理解 Visual Instruction Tuning Aligns Modalities 的方法或实验,请结合正文精读段落一起看。Figureure 27 · : Neighborhood Overlap between text-only and multimodal representationFigure 27: Neighborhood Overlap between text-only and multimodal representations for LLaVA-1.5. This repeats the layer-pair comparison from Figure 24 using Neighborhood Overlap, which measures preservation of local nearest-neighbor structure. Fine-tuning increases neighborhood agreement along intermediate-to-late layer pairs, supporting the same localized alignment picture with a geometry-preserving metric.这张图/表用于判断 Visual Instruction Tuning Aligns Modalities 的实验收益来自哪里。重点看替换、消融或跨模型设置下趋势是否一致,而不是只看单个最高分。