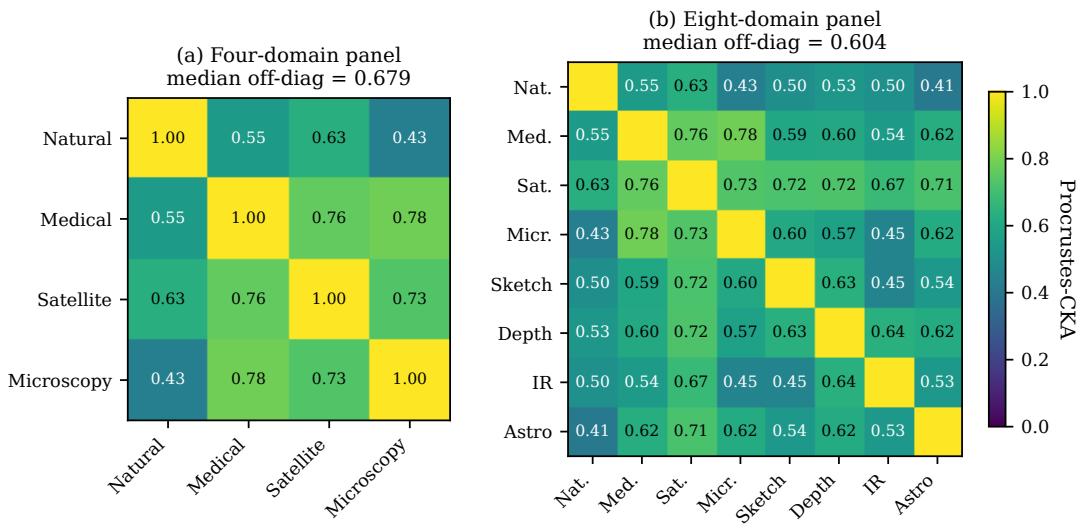
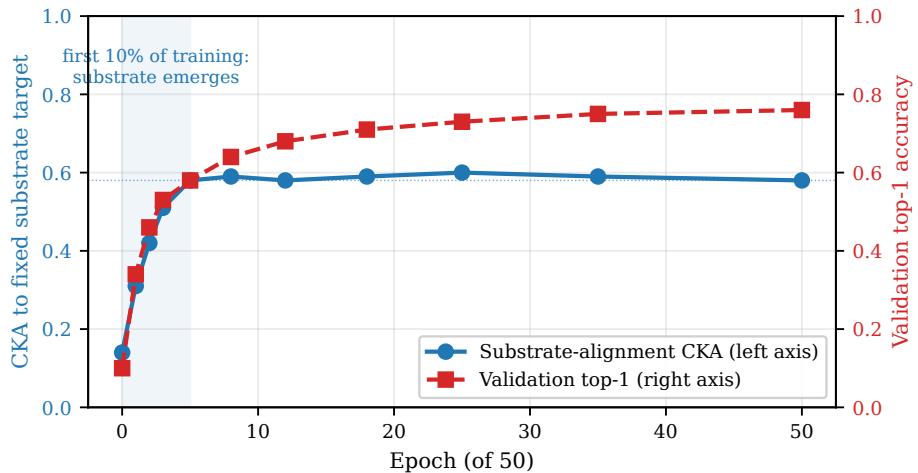
Figureure 1 · : The cross-architecture substrate transports across visual domainsFigure 1: The cross-architecture substrate transports across visual domains. (a) Four-domain PCKA matrix (Natural, Medical, Satellite, Microscopy): median off-diagonal 0.679 over 6 pairs. (b) Eight-domain PCKA matrix adding Sketch, Depth, Infrared, Astronomy: median off-diagonal 0.604 over 28 pairs, every pair $\geq 0 . 4 0$ , 25/28 pairs $\geq 0 . 4 5$ . Both bases at $K { = } 1 6 .$ , probe $\breve { N } { = } 1 , 0 0 0$ per domain, shared $\scriptstyle D = 5 , 8 8 8$ stacked feature frame, $E { = } 5$ encoders. See $\ S 3 ;$ full matrices in Appendix D.这张图概括 The Cross-Architecture Substrate 的整体方法流程。阅读时先看模块之间传递的训练信号,再看作者如何把目标拆成可优化的子问题。Figureure 2 · : Substrate emerges in the first 10% of training, before accuracy convFigure 2: Substrate emerges in the first 10% of training, before accuracy converges. ResNet-50 from random initialisation on ImageNette, 50 epochs. Blue (left axis): substrate-alignment linear CKA against the K=16 panel basis from §4; reaches 0.58 by epoch 5, stays in [0.50, 0.58] for the remaining 45 epochs. Red dashed (right axis): validation top-1 accuracy; climbs from 46% at epoch 5 to 76% at epoch 50. The substrate plateau precedes the accuracy plateau by $\geq 4 5$ epochs; see §5.这张图/表用于判断 The Cross-Architecture Substrate 的实验收益来自哪里。重点看替换、消融或跨模型设置下趋势是否一致,而不是只看单个最高分。