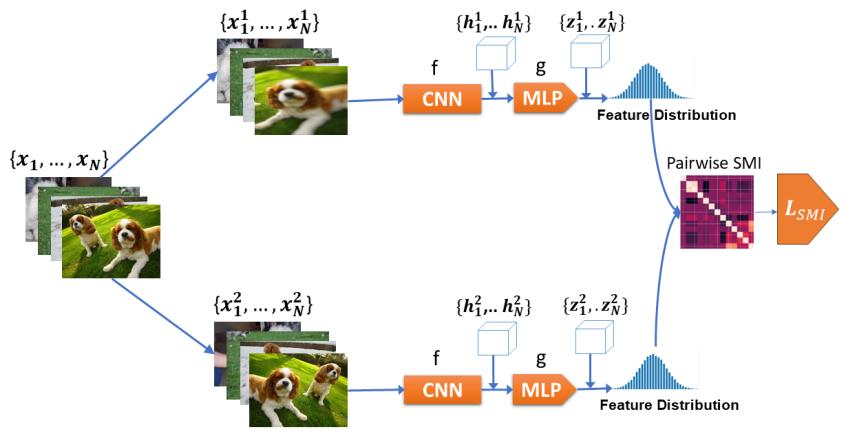
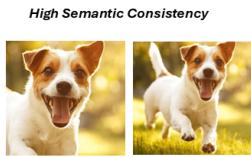
Figureure 1 · : Overview of the proposed method with our SMI loss.Figure 1: Overview of the proposed method with our SMI loss.这张图概括 SMI 的整体方法流程。阅读时先看模块之间传递的训练信号,再看作者如何把目标拆成可优化的子问题。Figureure 2 · : Analytical comparison of the optimization behavior induced by BarlowFigure 2: Analytical comparison of the optimization behavior induced by Barlow Twins and the proposed SMI objective. Left: Objective value as a function of dependency strength. Right: Optimization sensitivity measured by the gradient magnitude with respect to the correlation coefficient. Unlike direct correlation matching, SMI exhibits correlation-dependent sensitivity, assigning relatively little optimization emphasis to weak dependency regions while focusing optimization effort on moderate-to-high dependency regions. Bottom: illustrative examples of positive pairs exhibiting different levels of semantic consistency.这张图/表用于判断 SMI 的实验收益来自哪里。重点看替换、消融或跨模型设置下趋势是否一致,而不是只看单个最高分。