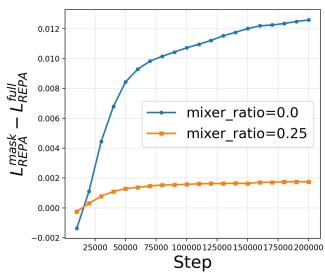
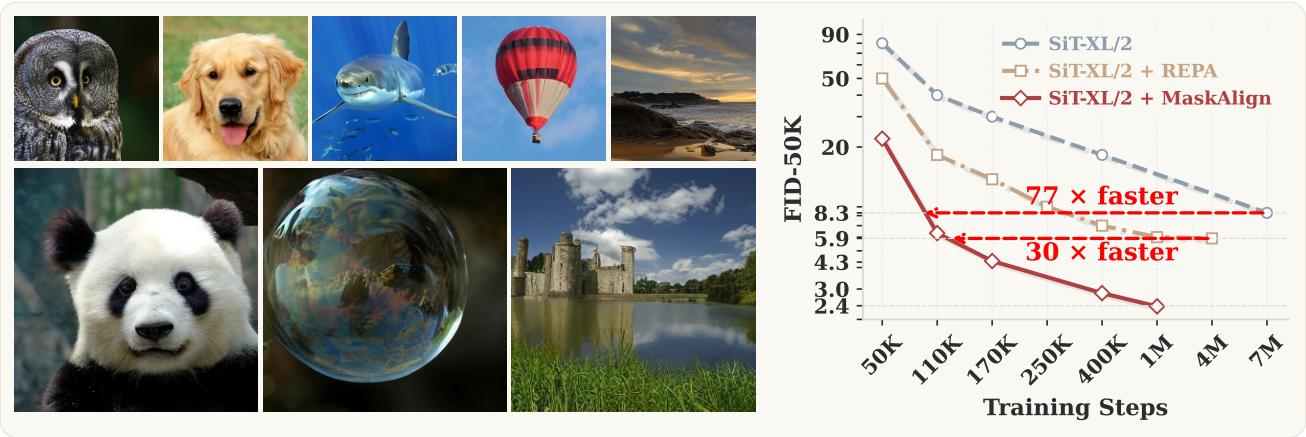
(d) Alignment-loss gap Figure 2 Token-level behavior and alignment stability under token m(d) Alignment-loss gap Figure 2 Token-level behavior and alignment stability under token masking. (a,b) Heatmaps show the probability that each spatial position appears among the top-10% alignment-gradient tokens, using the same color range [0, 0.8]. For reference, a uniform distribution would correspond to approximately 10% for each position. (a) Full-token alignment exhibits a stable spatial preference. (b) A 25% mask ratio substantially reduces this concentrated pattern. (c) MaskAlign lowers the full-token alignment loss. (d) $L _ { \mathrm { R E P A } } ^ { \mathrm { m a s k } } - L _ { \mathrm { R E P A } } ^ { \mathrm { f u l l } }$这张图/表用于判断 MaskAlign 的实验收益来自哪里。重点看替换、消融或跨模型设置下趋势是否一致,而不是只看单个最高分。Figureure 1 · MaskAlign generates high-quality ImageNet 256 × 256 samples and reacheFigure 1 MaskAlign generates high-quality ImageNet 256 × 256 samples and reaches comparable FID with substantially fewer training iterations, showing faster convergence.这张图来自论文 PDF 的结构化抽取。当前用于辅助理解 MaskAlign 的方法或实验,请结合正文精读段落一起看。