When to Align, When to Predict:它和通用视觉自监督的关系在于:给 cross-modal alignment vs prediction 一个相图,用于判断图文/多模态自监督目标何时该对齐、何时该预测
中高相关;详见方法、贡献和实验边界。
When to Align, When to Predict: A Phase Diagram for Multimodal Learning arXiv 新增 原文链接
编号2606.11190优先级P2类别arXiv 新增会议arXiv 新增方法给 cross-modal alignment vs prediction 一个相图,用于判断图文/多模态自监督目标何时该对齐、何时该预测来源arXiv / OpenReview
先说结论。它和通用视觉自监督的关系在于:给 cross-modal alignment vs prediction 一个相图,用于判断图文/多模态自监督目标何时该对齐、何时该预测。 中高相关;详见方法、贡献和实验边界。
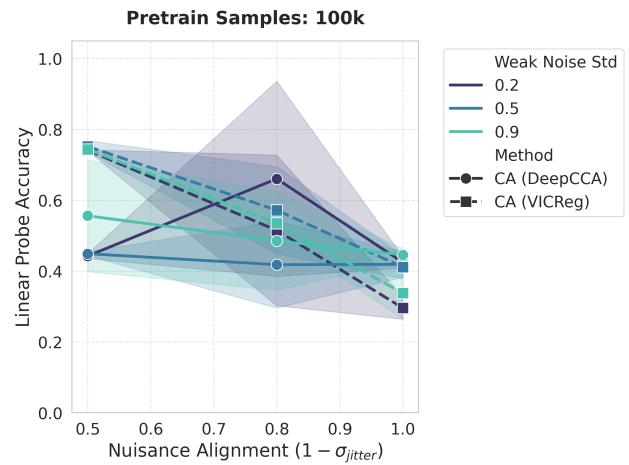
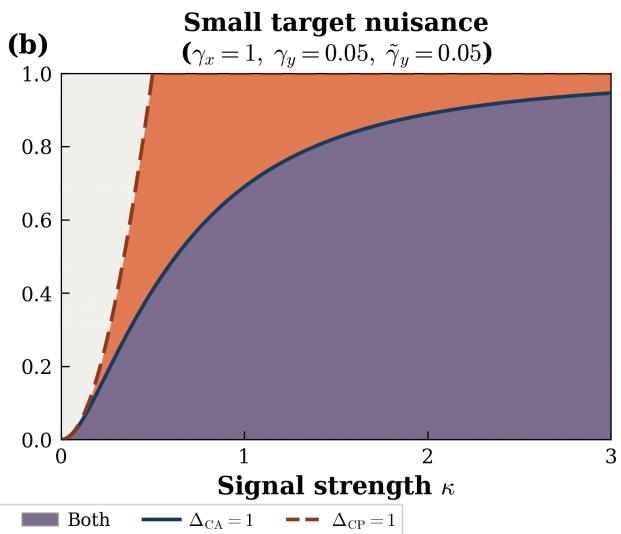
(b) Shape3D Figure 10: Comparison between VICReg and DeepCCA for dSprites and Shape3D expe(b) Shape3D Figure 10: Comparison between VICReg and DeepCCA for dSprites and Shape3D experiments这张图/表用于判断 When to Align, When to Predict 的实验收益来自哪里。重点看替换、消融或跨模型设置下趋势是否一致,而不是只看单个最高分。Figureure 2 · : Phase diagram for signal recovery in $( \kappa , \nu )$ space under Figure 2: Phase diagram for signal recovery in $( \kappa , \nu )$ space under the homogeneous model (all signal and noise components are equal). Solid and dashed lines respectively show the $\Delta _ { \mathrm { C A } } = 1$ and $\Delta _ { \mathrm { C P } } = 1$ boundaries from Proposition 3.1. (a) Large target nuisance $\left( \tilde { \gamma } ^ { y } \gg \gamma ^ { y } \right)$ . (b) Small target noise $( \tilde { \gamma } ^ { y } \sim \gamma ^ { y } )$ . Phase diagrams for the non-homogeneous case with partial recoveries are shown in Figure 7.这张图来自论文 PDF 的结构化抽取。当前用于辅助理解 When to Align, When to Predict 的方法或实验,请结合正文精读段落一起看。
核心问题
它和通用视觉自监督的关系在于:给 cross-modal alignment vs prediction 一个相图,用于判断图文/多模态自监督目标何时该对齐、何时该预测。
方法拆解
给 cross-modal alignment vs prediction 一个相图,用于判断图文/多模态自监督目标何时该对齐、何时该预测