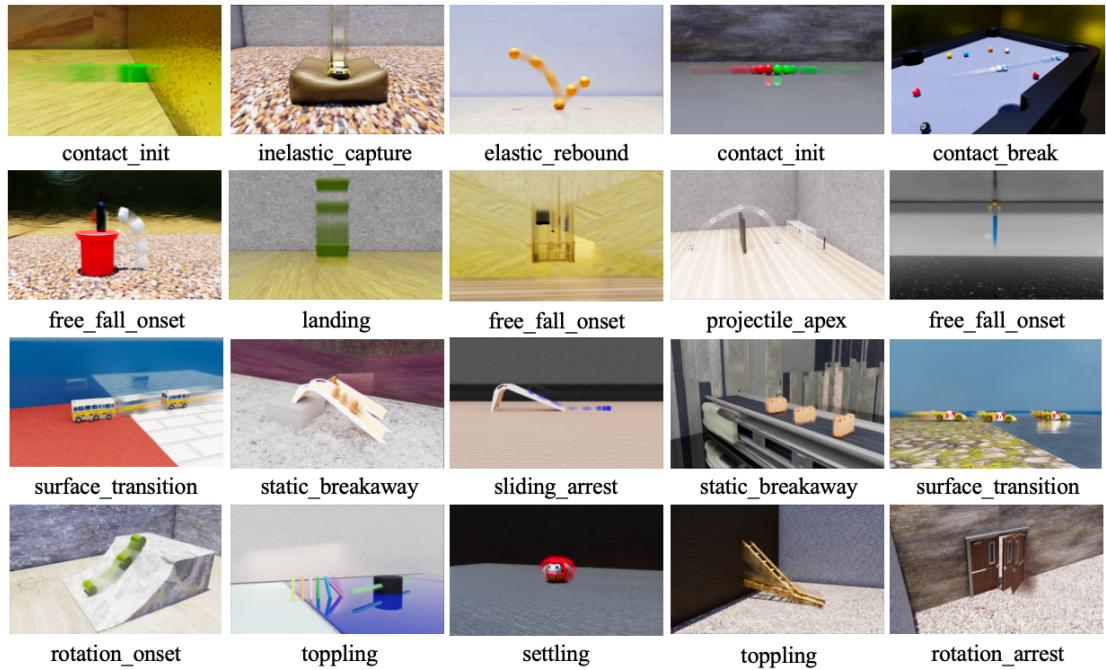
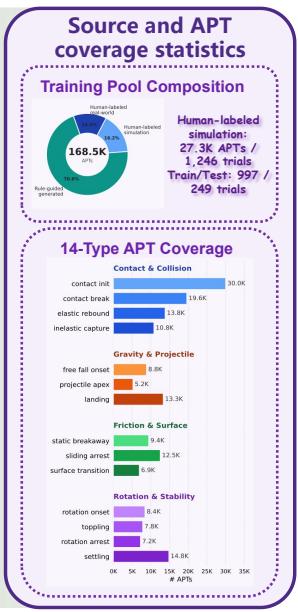
Figureure 2 · : Event-level comparison between standard event-level evaluation and AFigure 2: Event-level comparison between standard event-level evaluation and APT.这张图/表用于判断 APT 的实验收益来自哪里。重点看替换、消融或跨模型设置下趋势是否一致,而不是只看单个最高分。Figureure 3 · : APT data construction pipelineFigure 3: APT data construction pipeline. Human validation anchors APT semantics and coupling rules; LLM/YAML templates drive asynchronous domain-randomized simulation; VLM grounding identifies rendered objects; and simulator GT traces provide realized APT labels and timestamps. The accepted clips are exported as multi-format supervision with full 14-type coverage.这张图概括 APT 的整体方法流程。阅读时先看模块之间传递的训练信号,再看作者如何把目标拆成可优化的子问题。