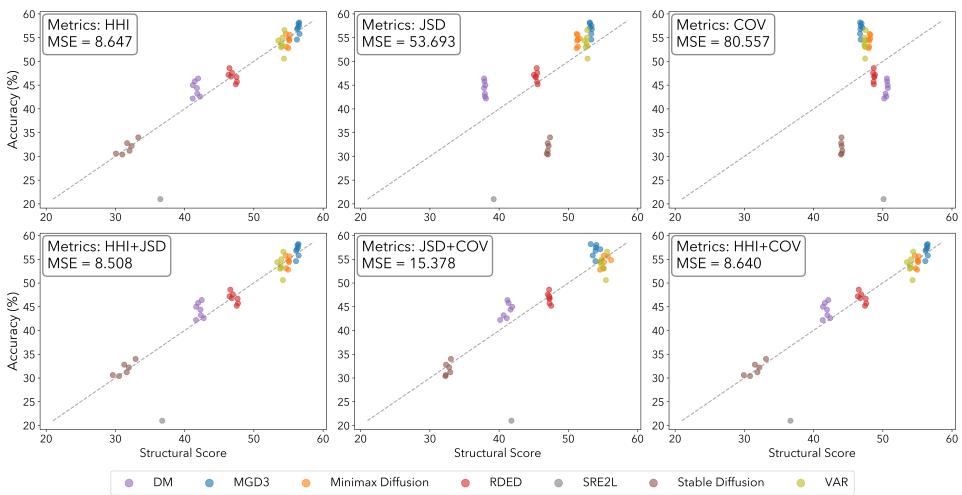
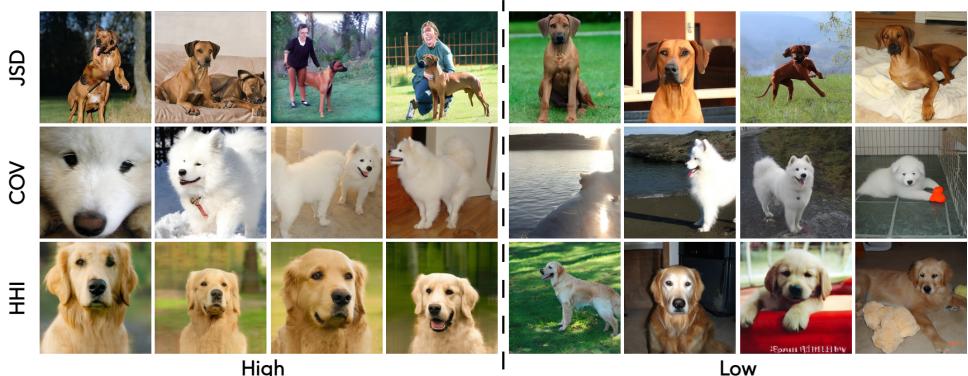
Figureure 3 · : The ablation study of diferent combinations of token statistics (HHIFig. 3: The ablation study of diferent combinations of token statistics (HHI, JSD, COV) in predicting model accuracy via linear regression. Each subplot shows the relationship between the adopted token statistics and model accuracy across various distilled datasets, with Mean Squared Error (MSE) reported.这张图/表用于判断 Structural Assessment for Understanding and 的实验收益来自哪里。重点看替换、消融或跨模型设置下趋势是否一致,而不是只看单个最高分。Figureure 4 · : Qualitative comparison of images with high and low values of JSD, COFig. 4: Qualitative comparison of images with high and low values of JSD, COV, and HHI metrics. Each row corresponds to one metric, with images on the left exhibiting high values and those on the right showing low values.这张图/表用于判断 Structural Assessment for Understanding and 的实验收益来自哪里。重点看替换、消融或跨模型设置下趋势是否一致,而不是只看单个最高分。