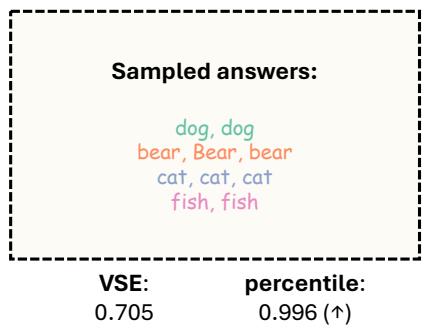
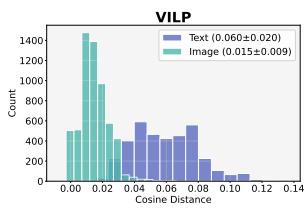
Figureure 11 · : Qualitative ResultsFig. 11: Qualitative Results. Failure cases where VSE is low for incorrect answer (top) and high for correct answer (bottom). In the bottom example, the visual evidence is highly ambiguous, suggesting that the model arrives at the correct answer largely by chance.这张图/表用于判断 Visual Semantic Entropy 的实验收益来自哪里。重点看替换、消融或跨模型设置下趋势是否一致,而不是只看单个最高分。Figureure 3 · : Embedding shifts induced by text and image perturbationsFig. 3: Embedding shifts induced by text and image perturbations. For each image–question pair, we generate semantically equivalent paraphrases and image perturbations, then encode all inputs using the Qwen3-VL-Embedding-8B multimodal embedding model. The cosine distance between each perturbed embedding and the original embedding is measured. Across datasets, textual paraphrases produce substantially larger embedding shifts than image perturbations: 0.063 vs. 0.014 on MMVet, 0.119 vs. 0.029 on VLMs Are Biased, and 0.060 vs. 0.015 on VILP.这张图来自论文 PDF 的结构化抽取。当前用于辅助理解 Visual Semantic Entropy 的方法或实验,请结合正文精读段落一起看。