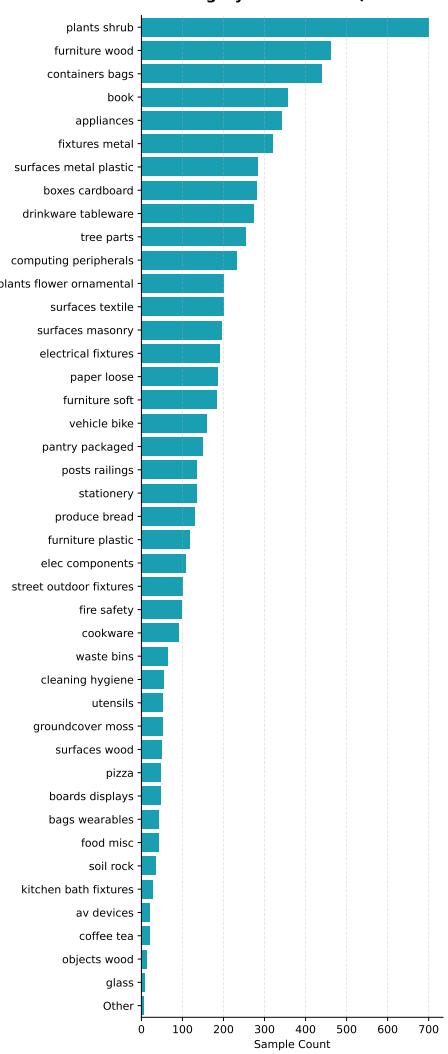
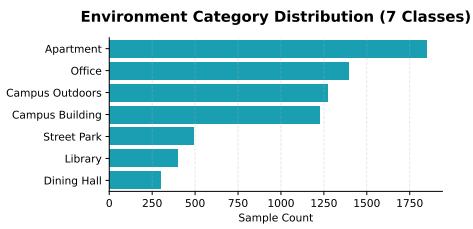
Item Category Distribution (43 Classes) (b) Item Categories (43 classes) FigItem Category Distribution (43 Classes) (b) Item Categories (43 classes) Fig. 7: Taxonomy distribution of the NYS benchmark. We visualize the label frequency for the two classification probing tasks: (a) the 7 Environment categories and (b) the 43 Item categories. Note the long-tail distribution in the Item classes, which challenges the model to learn robust categorical representations from imbalanced enose signals.这张图来自论文 PDF 的结构化抽取。当前用于辅助理解 What Images Cannot Say 的方法或实验,请结合正文精读段落一起看。(a) Environment Categories (7 classes)(a) Environment Categories (7 classes)这张图来自论文 PDF 的结构化抽取。当前用于辅助理解 What Images Cannot Say 的方法或实验,请结合正文精读段落一起看。