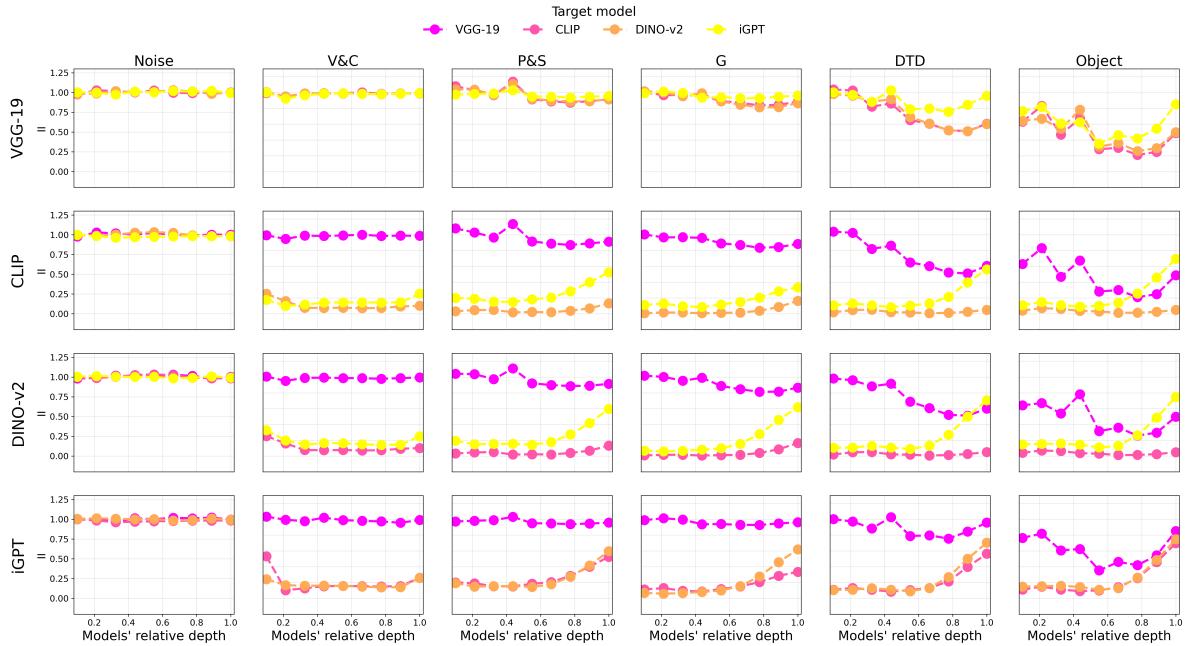
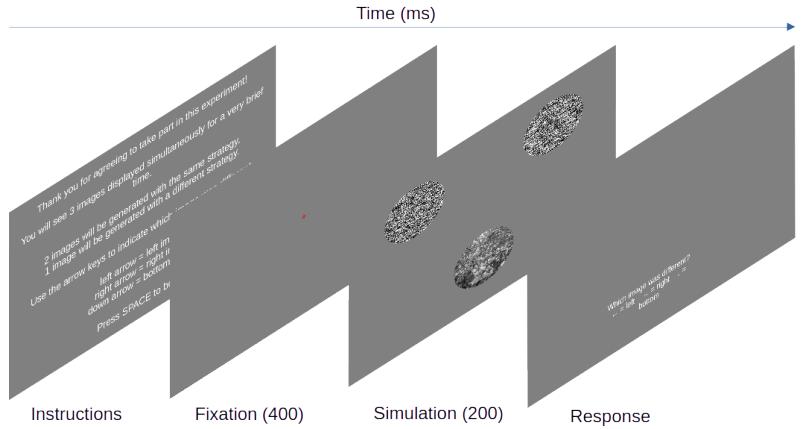
Figureure 7 · : Extended plot for Section 4.2, Figure 2: For each dataset (columns) Figure 7: Extended plot for Section 4.2, Figure 2: For each dataset (columns) we compute II for each pair of models. In particular, as shown in the rows, each model serves as a reference, and the other three serve as target, as shown in the columns and in the top legend. We quantify the depth of each feature’s layer as the relative percentage, and compared symmetrized II scores between reference layers and target layers along the same relative depth.这张图来自论文 PDF 的结构化抽取。当前用于辅助理解 Texture Representations in Deep Vision 的方法或实验,请结合正文精读段落一起看。Figureure 11 · : Illustration of the experimental flow, with time in msFigure 11: Illustration of the experimental flow, with time in ms. Each simulation is paced at 200ms, proceeded by a 400ms red fixation cross. Response time is self paced. Breaks between trials are provided.这张图来自论文 PDF 的结构化抽取。当前用于辅助理解 Texture Representations in Deep Vision 的方法或实验,请结合正文精读段落一起看。